

Real-time data in urban planning is information refreshed frequently enough to support the decision being made. Traffic counts, water levels or energy readings can help teams understand changing conditions. A live feed is useful only when its quality, coverage and update interval are appropriate; it does not automatically improve a plan.
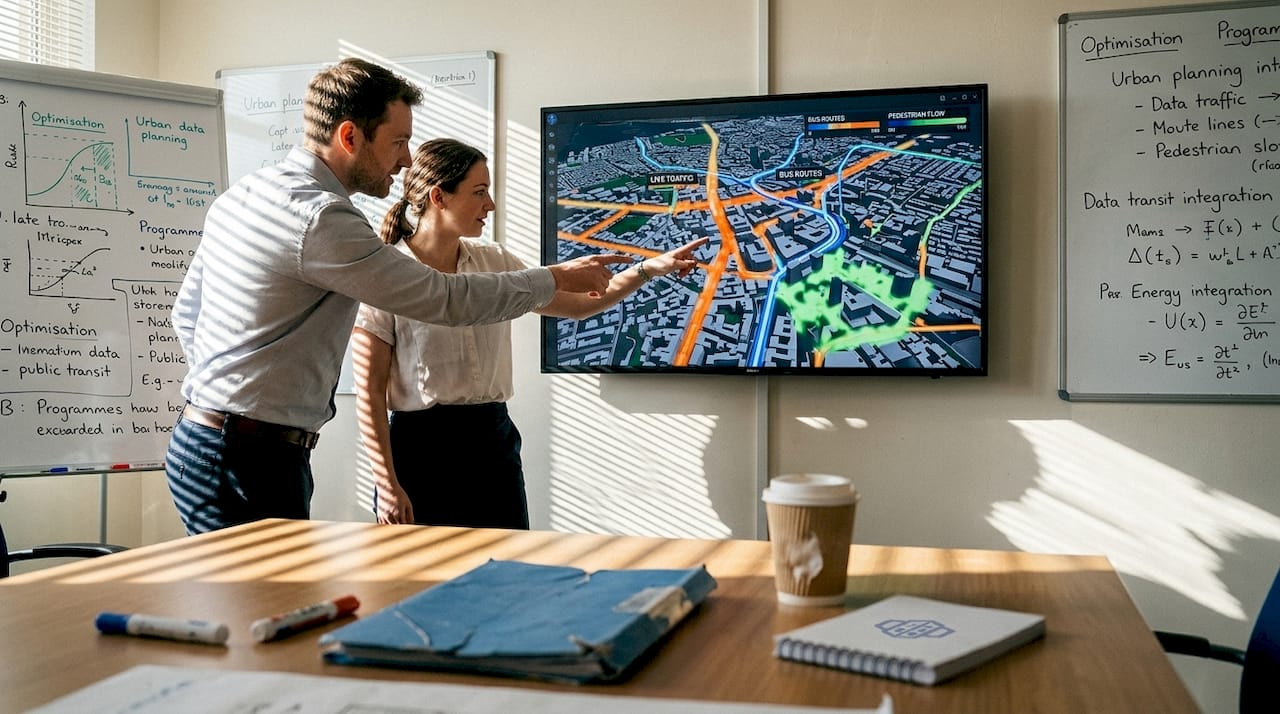
Decide whether live data is necessary
Separate long-term planning from operational control. A housing-capacity study may need reliable parcel boundaries and current planning controls more than second-by-second readings. A flood-response dashboard may require much faster updates. Write down the decision, who will act on the information and how quickly an update could change that action.
Build a traceable data workflow
- Define the question. For example, ask whether a proposed street arrangement needs a more detailed traffic assessment.
- Inventory the sources. Record the owner, licence, geographic coverage, measurement units, timestamp and update frequency.
- Check the observations. Identify missing readings, sensor drift, duplicates and changes in how measurements were collected.
- Align the geography. Match records to the correct road, building or area and verify the coordinate system.
- Compare with a baseline. Include time of day, season and exceptional events so a short-lived change is not mistaken for a lasting trend.
- Document the response. Explain what the evidence supports, what remains uncertain and who is responsible for the next decision.
Keep observations and predictions distinct
A sensor reading describes a measurement at a particular location and time. A model prediction estimates a condition under stated assumptions. A 3D view can display either, but visual detail does not establish predictive accuracy. Label measured, inferred and simulated layers separately and retain the dates and assumptions behind each comparison.
For an illustrative district study, compare weekday and weekend traffic patterns before choosing representative periods for analysis. Then test proposed connections using an appropriate transport model. The observed counts establish the baseline; they do not by themselves predict the effects of an unbuilt road.
Measure value without promising a universal percentage
Define a pilot measure such as analyst time per validated dataset, missing-data rate or time needed to prepare a scenario review. Record the starting position and compare the same task after implementation. Include integration effort, subscriptions, staff training and maintenance. Results from another city are not a forecast for your project.
Where 3D Cityplanner fits
3D Cityplanner provides an area-scale environment for spatial data, development alternatives, project indicators and review. Connected sources depend on the project setup. Specialist operational systems and validated transport or environmental models remain responsible for their own calculations. Review the 3D Cityplanner features and the digital twin city guide when defining the scope.
Frequently asked questions
Does every urban digital twin need real-time data?
No. A maintained spatial model with periodic updates may be sufficient for development scenario work. Match the refresh rate to the decision.
What should a team test first?
Choose one decision and one dependable source. Validate the link between the source, its spatial representation and the action it is intended to support before expanding.


